---------------------------------------
By GEORGE HALVORSON
This is the second part of former Kaiser Permanente CEO George Halvorson’s critique of Medpac’s new analysis of Medicare Advantage.Part 1 is here. The final part will be published on THCB later this week. Eventually I’ll be doing a summary article about all the back and forth about what Medicare Advantage really costs!-Matthew Holt
We clearly do have significant levels of quality data about the MA plans because we have extensive levels of quality programs and recognitions that exist in MA . Those programs get better every year — and MedPac should be reporting and even celebrating each year how many additional plans are achieving high scores in those areas as part of their report.
MedPac should be describing and celebrating progress that is being made in that five-star space and the members of the Commission don’t seem to know that information exists.
In fact, they sink lower than that pure denial in their report this year. They actually say in this year’s report that they have deep concerns about the quality of care for MA and they say clearly that they have no useful data to use for thinking about how MA is doing relative to quality issues.
Saying that there is no quality data about the plans is another MedPac falsehood (MPF) and, as they so often are, that particular falsehood is disproved quickly and easily by their own documents. In the final section of this year’s report where they were asked by Congress to do a report on the quality of care in the Special Needs Plans. The MedPac writers achieve that explicit goal in large part by using the easily available HEDIS quality data for those patients and for the other patients in the plans and by comparing both sets of numbers to relevant populations.
So this year’s report has that set of NCQA quality data for the MA plans included in it. MedPac is using it now even though they say no data exists and that means that’s another falsehood to say it doesn’t exist.
We know what the quality data of the five-star program is and we know what the HEDIS Scores are for the MA plans, and we also know how much MA costs us in every county because the bids give us that information.
We know that the plans bid below the average county fee-for-service Medicare costs in every county and we know what the total costs are by person for each county.
We need to know what the real costs are and we need to look at how we get the very best use of the Medicare dollar. MedPac should make it a priority to figure out how to get the best use of the Medicare dollar using both bids, capitation, and various kinds of ACO-related payment processes. ACOs all create better care than traditional fee-for-service Medicare, and the people who are critical of ACOs for not saving enough money should rethink their priorities. They should be happy with any use of the Medicare dollar that gives more for the member and patient
If an ACO that has team care and patient centered data flows just breaks even on costs relative to fee-for-service Medicare, that should be celebrated and supported as being a much better use of the Medicare dollar.
We should make patients our top priority. ACOs make patients their priority. MA Plans clearly set up benefits and care practices around the patient’s the top priority. Only fee-for-service Medicare completely lets the patient down by being rigid on benefits, rigid on service, and making costs a higher priority than people’s lives and doing that badly and inefficiently. We should be working through MedPac each year to see which approach to buying care actually gives us the very best use of our Medicare dollar.
How MA bidding works
The annual bidding process for the plans is important and it is not very well known to most policy people or to the news media in our country today. It directly anchors costs for every county for every MA member.
The plans each bid an amount in each county that will determine what they get paid in each county for each enrollee. They receive their capitation amount every month, meet the administrative and care delivery requirements that outlined in their MA contracts, provide all levels of needed care, and then they either make money or lose money on their bid.
That bid is a very powerful, important and relevant tool, because the capitation rate is the total amount that Medicare will ever have to pay for each MA patient. That cost control impact is an important point to understand. That bid and the capitation it creates actually caps costs and it defines costs for that patient.
Unlike fee-for-service Medicare — where the caregivers can and often do make much more money when their care fails because failures of their care in fee-for-service health care often increase the number of fees that are paid for a patient — the capitation rate paid to a plan is the full cost to Medicare for that patient and it can’t be increased in any way.
A congestive heart failure patient goes through pain, dislocation, and sometimes even fear of dying or fear of being permanently damaged when they have a congestive heart failure crisis — and the plans actually can save both money and save lives by not having those crises happen.
Those very same heart failure crises are often very profitable for fee-for-service Medicare care providers because they can and do generate from $20,000 to $40,000 in additional revenue for the care sites when they happen to occur for patients.
So, MA plans all build congestive heart failure crisis prevention protocols and fee-for-service Medicare does not even support or pay for the steps needed to put those processes in place.
So when the MedPac staff writes, as they actually do each and every year, that there is no fee-for-service quality data available and therefore they can’t comment on the relative or relevant quality issues for MA plans because those comments would be inappropriately unfair to the fee-for-service Medicare program, that is another inexplicable part of MedPac’s thinking. Their approach to reporting on MA should change before they write another annual MA report.
The actual impact of MA on people is ignored
They also inexplicably, unfortunately, and very completely ignore actual people in their MedPac staff annual report on MA .
They have no part of their annual report on MA that deals with the issues and the impacts of any of the actions or issues or processes on actual people and their lives. They have managed to write an entirely people-free report as their annual advice to Congress about the MA program. That does not seem possible, but it is clearly true and it is clearly intentional because the “people gaps” are so obvious and visible.
For example, Covid has just done damage to a lot of people in our country. Covid has been a major issue for people’s lives and for people’s care over the past couple of years. The MedPac report completely skips the topic of Covid impact on people except to speculate about whether Covid might have affected costs for either program in some way.
In the real world of people, there often were huge and obvious differences between the Covid responses of the MA plans and Covid responses of fee-for-service Medicare. A people-oriented annual report from MedPac on MA would have looked at those differences and pointed them out as very different uses of the Medicare dollar that happened down each of those payment pathways.
Every MA patient had a complete care-related contact system and support processes that were consistently and immediately in place. MA plans were recognized for being among the very first care sites in the country to have some of the Covid tests in place and they even sent nurses into homes to help with care very early in the process.
Every single MA member had the security from day one of knowing where to go for their Covid care. They all had care sites immediately because they were all members of plans, and those care sites and care systems in the plans all went through their own learning process to figure out the relevant Covid-related issues of care.
Fee-for-service Medicare had nothing.
Fee-for-service Medicare had no Covid plan or Covid-related approach. Fee-for-service Medicare left many people functionally orphaned and isolated because the fee-for-service enrollees who already had some level of care relationships in place could try to get into those sites but the people with fee-for-service Medicare Coverage who did not have care linkages in place were simply orphaned by Covid. They had to scramble on their own to find Covid care and information with literally no support from fee-for-service Medicare.
MedPac is supposed to be writing a report evaluating MA .
This year’s MedPac report should have led with a report and an update on Covid in those various settings and it should have included an informed discussion of what we learned in the process — and MedPac completely and carefully dodged the issue. It wasn’t even mentioned because MedPac does not mention or include people in their report in any case and it is also much easier to continue to be generically critical of MA if you leave people and their lives out of your analysis, research, thinking, and report.
How Medpac calcluates MA “costs”
What they did mention, in several places and in multiple pages of the report, was that they believed that MA capitation is too high and they stated that the capitation is more than Medicare would have spent for those same enrolled people if they had not enrolled in MA Plans.
They stated a couple of times that when they looked at how much fee-for-service Medicare would have spent paying for care “for those same exact enrollees,” it appeared to them that that number spent to buy each piece of the care that actually happened for those MA members was lower than the actual capitation that was paid to the plans for those exact same enrollees.
They estimated from that particular calculation that it cost about 4 percent more in capitation last year than Medicare would have spent buying those exact sets of Medicare services for those same patients if the people had not been enrolled in the plans.
They repeat that perspective and that conclusion several times. It’s also actually almost the only line chart in the entire report. Figure 12.3 (cut and reproduced below) has the number.
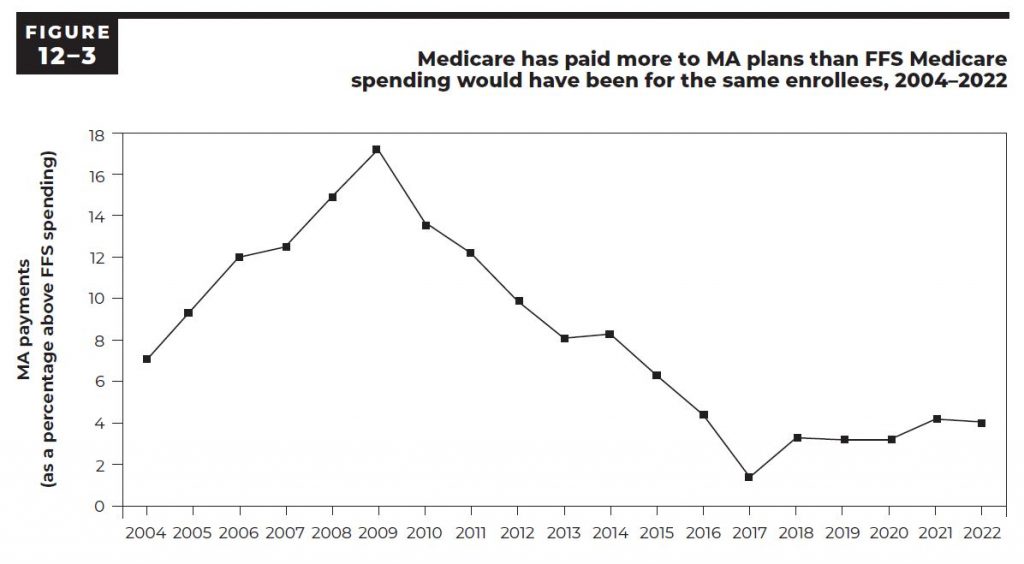
They run the numbers back to 2004 to show that the number has existed as a difference between those calculations every year and that the distance has been consistent over time.
That chart and conclusion gets quoted in multiple settings in health care policy circles as being basic context for whether the plans are overpaid and many people in both media settings and academic settings believe that number to be true and cite it in various places.
The problem with that number and with that calculation is that they very carefully price only the exact pieces of care received by those members and some of the most relevant pieces of care do not happen for those exact members because care is actually much better in MA plans. The capitation calculation numbers that create the baseline data and the bidding floor for each county are inclusive average numbers for the fee-for-service Medicare patients in each setting and they are based on and include the higher costs of poorer care that generally is delivered in fee-for-service Medicare.
The differences are easy to see and understand.
MA members have about 35 percent lower use of emergency rooms. They also have a significantly lower number of congestive heart failure related events. The fee-for-service care that was the basis for the capitation calculation and baseline number had all of those higher expenses built into them. That means that the only way that number from figure 12.4 can legitimately be used by MedPac to evaluate the relative costs now would be to add the relevant ghost numbers for those better care patterns back into the amount to show the cost that Medicare would actually have spent for those patients if they had not been enrolled in MA plans.
The MedPac staff clearly knows that those are fake and deceptive conclusions about the patterns of care and about the relative costs of the programs because they actually say very clearly in this year’s report — toward the end of the report in a discussion on another topic: “Plans steer patients away from an emergency department when an urgent care clinic or physician visit would suffice and is available.”
So even this report as written shows that they know that truth about those care pattern differences.
They very carefully tee up the illusion of a higher payment level for capitation each time by saying: “This is exactly what those exact same MA patients would have cost if their exact levels of care had been purchased by fee-for-service Medicare using the fee-for-service fee schedule.”
That is only legitimate information if they add to that cost number they compute for the current enrollees’ levels of care by putting those emergency room visits back into the cost total.
The average difference in costs of care that should be added back into that calculation to make the conclusion and to make the comparison with current members’ costs legitimate is actually about 9 percent additional costs — based on other available data. Without that 9 percent, this is false information and it is fake news.
How much do MA members actually cost?
What is true about the relative cost of care for people who enroll in MA ?
That is actually also relatively easy to see and know and it is also already embedded in this same report at several levels.
The bids are key.
The bid process and the numbers that relate to it already show us how much different the costs are for Medicare and for MA . The average area’s costs for fee-for-service Medicare are very legitimate costs. The bids then create the actual cost of MA measured in real dollars. The plans bid each year for every county and those bids both indicate what the cost differences are and what they have created in each county as the total cost each year to Medicare. We don’t need to guess or approximate or estimate the costs of the plans to Medicare because we now pay them in capitation each month. We don’t need to speculate about how much the plans might somehow cost us in total because the bids result in a capitation and because the capitation that is paid creates the actual cost and we know exactly what those capitation payments are.
So what are the bids?
The plans actually bid less than the average cost of care for fee-for-service Medicare in each of those areas.
The plans this year bid an average of 86 percent of the average Medicare fee-for-service costs in the counties.
That means that if nothing else changed, Medicare would spend 86 percent of what it spent last year to provide care in that county for those enrollees.
That initial bid isn’t the final cost. MA has what is probably the best quality assurance program of any government purchased care program in the world. That program includes a five-star process that tracks care and service and actually awards plans from one to five stars for their measured levels of performance, and then pays more money to the plans with more stars.
Those standards set by that program have a huge impact on American health care because so many care sites are involved in MA as their source of payments and patients and because so many care sites have done very intentional and explicit work needed to earn the stars.
Thousands of care sites linked to MA plans have a chance to do better on their payments and their cash flow if they manage the blood sugar levels of their diabetic patients well, and the care teams get better every year in delivering that care and making sure their diabetics have care teams focusing on their care and getting it right.
Diabetes is the number one cause of blindness in the United States. Diabetes is the number one cause of amputations in America and it is also the top priority and most damaging co morbidity for causing death from heart disease. It is a very good thing that we have a five-star program in MA that encourages large numbers of doctors and many care teams in many settings to provide better care for their diabetic patients.
Those MA quality programs sometimes also have an extremely positive spillover community benefit impact on all patients in a care site or a community because the doctors in each setting prefer to practice consistent care and that level of better care rewarded by MA tends to be extended to all of the patients in those sites and settings. Several studies have shown very positive quality improvement spillover impacts exist on high volume MA counties from those programs.
MA pays money for that to happen.
Higher scores on the five-star quality results can and do actually significantly increase payment levels for plans. Plans can earn up to 5 percent more dollars by having more quality stars.
That program has probably had the biggest improvement on care quality for large populations and for a wide range of care teams of any other single program in the world. It has actually changed care at levels we can see and track over time. Again — the evidence on how well that program is doing is hiding in plain sight.
When the program was first started, less than a dozen very high performing plans in the entire country earned five stars and very few plans even had four stars. Plans and care sites across the country have worked hard and very intentionally on those quality processes since that time and today we have reached the point where more than 70 percent of the MA members are now enrolled in four- or five-star plans.
That is a major and visible improvement. CMS appreciates that progress and CMS has done wonderful and increasingly effective work in encouraging and supporting those levels of performance improvement in the care sites,
MedPac, however, doesn’t even seem to know that this work exists. The MedPac commissioners don’t ever talk about those parts of the MA program in their meetings and they don’t seem to have any knowledge that those programs or measurements and culture changes for care sites that have roots in MA even exist.
It’s not damaging the country or the overall program for MedPac to have a high level of ignorance about those issues because the people who actually run Medicare for CMS do understand the tool kit completely and the people in those leadership positions at CMS understand and support the approaches and use them well.
The people who run CMS will probably enhance several pieces of that process at this point for the Special Needs Plans in very high impact ways, and care will improve for that very important population of people as part of that agenda and of that focus by CMS .
MedPac, by contrast, has an almost inexplicable void in that area in their thinking and in their annual report.
That avoidance of the quality issue is just wrong.
George Halvorson is former CEO of Kaiser Permanente
-----------------------------------------
By: matthew holt
Title: MedPAC Got It Wrong (pt 2)
Sourced From: thehealthcareblog.com/blog/2022/03/31/medpac-got-it-wrong-pt-2/
Published Date: Thu, 31 Mar 2022 16:45:45 +0000
Read More
Did you miss our previous article...
https://prohealthsciences.com/general-health-and-wellness/success-story-update-six-million-steps-later